When you consider the fact that nearly 70% of all clicks go to the first five organic results in a search engine, it’s clear that SEO is vital to getting more traffic, more leads, and more sales.
But how do you figure out what’s working with your SEO strategy? And, maybe more importantly, what’s not working?
You have to measure and track your SEO performance.
This helps you stay on top of your SEO to catch issues before they become big problems. When you know what’s happening with your SEO, you can make adjustments as needed.
In this article, we’re going to show you how to use Google Analytics to track and improve your SEO.
What Is Google Analytics?
Google Analytics is a free website analytics software. It’s the most popular website analytics software in the world and lets you see data about how users find, engage, and navigate your site.
Google Analytics includes tons of reporting capabilities including, traffic sources, bounce rate, conversion rate, popular landing pages, and pageviews.
Getting Started with Google Analytics
To get started with Google Analytics, you need an account. Rather than recreate the steps to creating a Google Analytics account here, please check out Google’s instructions.
You’ll see the Home dashboard when you first log in to Google Analytics:
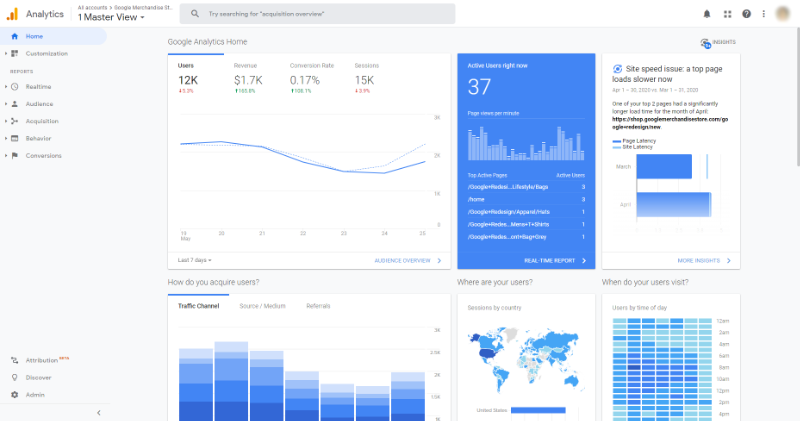
This gives a quick, very high-level overview of your analytics, but it doesn’t give you much in the way of actionable insights.
It’s better to look at the reports you can find in the menu on the left of the screen.
Let’s take a look at the landing pages report so you can see what information is included:
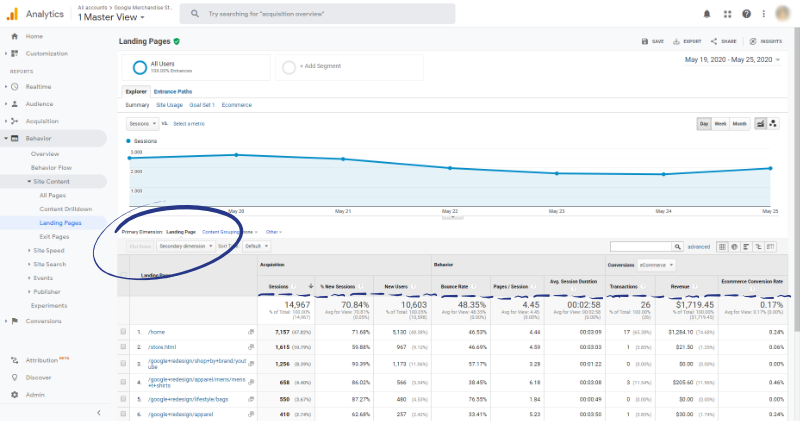
As you can see, reports show dimensions (attributes of data) and metrics (data points) about those dimensions.
On the report above, the dimension is the landing page. The other columns on the report show metrics like sessions, bounce rate, transactions, and more for those landing pages.
But what if you want to see how each landing page is performing by device (desktop vs mobile)?
Easy. Just add Device Category as a secondary dimension:
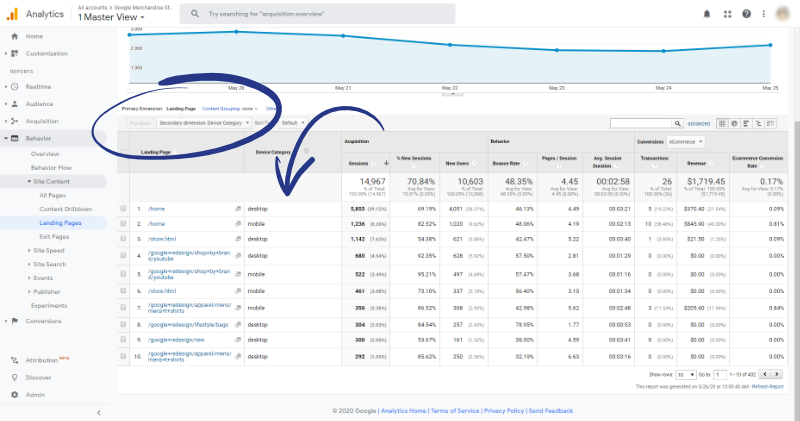
Now you can see the metrics for each landing page broken down by device.
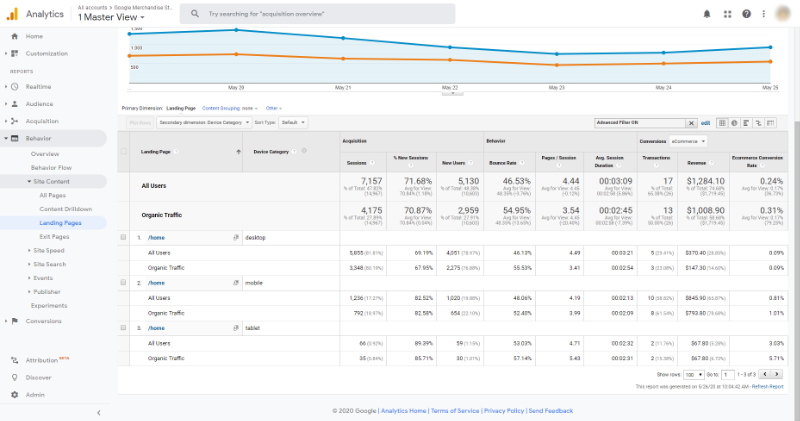
If you want to get really granular, you can include segments and filters to show subsets of your data.
Here’s what you get when you add a segment of Organic Traffic and filter the results to only include pages exactly matching home:
If you want to learn more about the basics of Google Analytics, we recommend using Google’s resources.
If you’re ready to learn how to use Google Analytics to improve your SEO, keep reading!
Top 7 Ways to Use Google Analytics for Better SEO
As you’ve already seen, Google Analytics provides all the data your business needs to monitor your SEO performance. In this section, we’ll share seven key ways you can use Google Analytics to put that data to use.
Quick Tip: Before you get started, we recommend that you connect Google Search Console to your Google Analytics account.
1. Update and Republish Old Posts
Your page rankings will change over time. That means you can’t just publish a post and forget about it. Even a well-optimized one with evergreen content.
As more content gets added to search engine indexes and search algorithms change, even the best pages will see fluctuations in rankings. That’s why it’s so important to have an SEO strategy in place.
To find pages that may need to be updated and republished, go to Acquisition > Search Console > Landing Pages in Google Analytics. Choose a timeframe to compare (since you’re looking for content that needs to be updated, look at periods of at least six months).
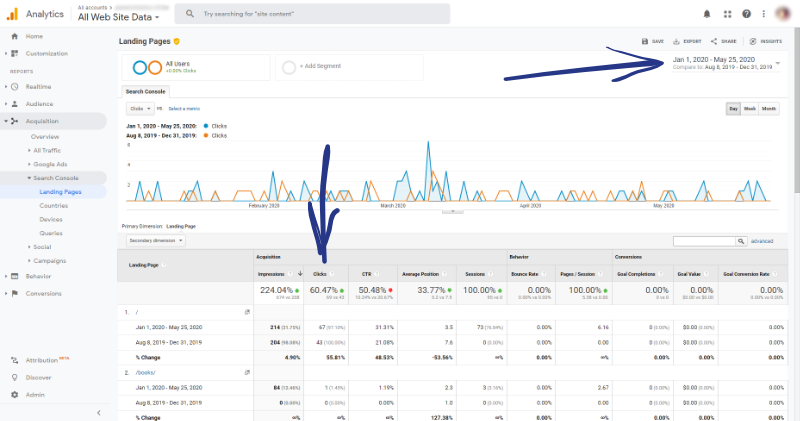
Sort the table by clicks and choose the landing page you want to see search query data for.
What are you looking for?
Ask if the page is about a topic that benefits from being updated. Basically, is the page “fresh” and does it have to be?
Remember that you can add secondary dimensions to dig deeper into the data.
2. Improve SEO on High-Converting Pages
Chances are, you want your SEO to drive more sales. A really easy way to do that is to make sure that your most valuable pages (the ones with the highest conversion rates) are ranking well.
We’re going to use the same report we used in #1, above: Acquisition > Search Console > Landing Pages.
This time, though, we’re going to choose a goal and sort the table by conversion rate. This will show you your highest-converting pages.
Next, put the URLs for your highest-converting pages into your keyword research tool to find out what keywords the pages are ranking for.
Focus on the keywords where you’re ranking in positions 3–10. Using your keyword research tool, you can find out who outranks you for your target keywords.
Then, make your content better to improve your website ranking and grab those top spots from your competitors.
3. Make High-Converting Landing Pages Even Better
Most of the time, people will have multiple touchpoints with your business before they decide to buy from you.
By default, Google Analytics attributes conversions to the last landing page a user visits before they convert.
But the customer journey isn’t necessarily linear.
This means that a visitor could read a blog post then go about their life for the next two weeks. Then, they come back to your site and make a purchase.
The decision to purchase could very well have been influenced by their visit to your blog two weeks prior to the purchase, but Google doesn’t acknowledge that in your conversion reports.
Since that page wasn’t credited for the conversion, you wouldn’t know that it’s a high-converting page that could convert even more with some SEO updates.
So, how do you find these pages that assist with conversions but may not be directly credited?
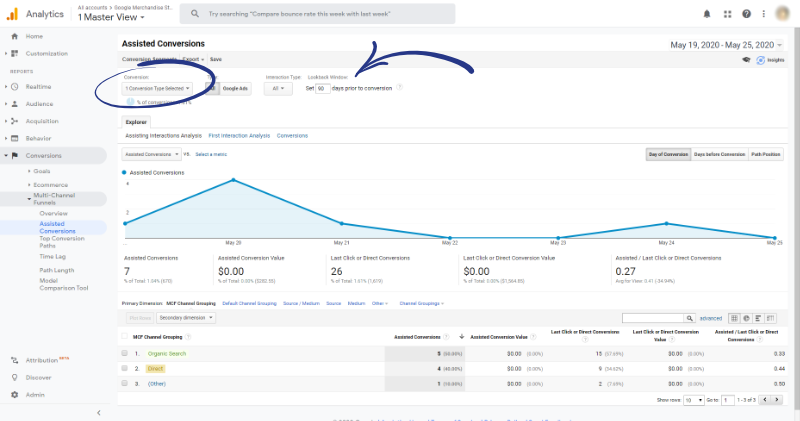
In Google Analytics, go to Conversions > Multi-Channel Funnels > Assisted Conversions.
Choose a conversion from the dropdown and set your lookback window (this is the number of days that you want to be taken into account before the conversion).
4. Use Internal Site Search to Find Keywords
If you have an internal search engine on your site, you have a goldmine of potential keywords to create content around.
To find out what people are searching for on your site, go to Behavior > Site Search > Search Terms.
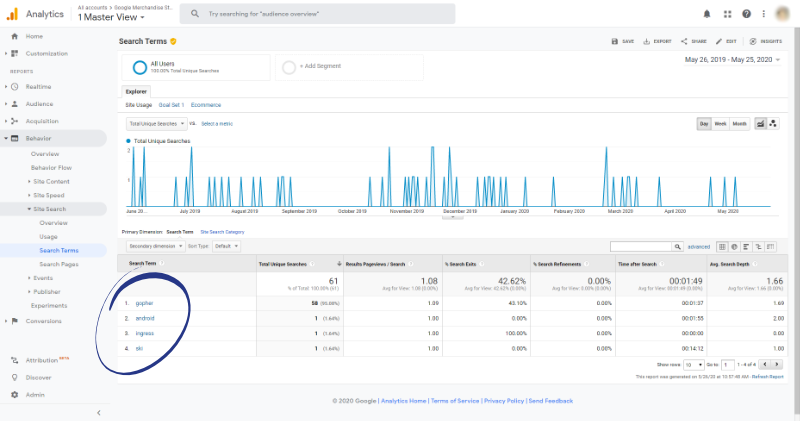
You’ll want to identify keywords that you don’t already have content for on your site.
If you have a longer list, you can sort the table by % Search Exits and use the weighted sort type.
This report shows internal searches by users that didn’t show a useful result so the user left your site.
We recommend doing some keyword research to find out if there’s search volume for the keywords you get from this report. Plus, you can find related keywords you might want to write about.
5. Set Up Custom Alerts to Monitor Traffic
Google Analytics lets you create custom alerts to let you know about traffic dips and spikes. While you can manually monitor for traffic changes, it’s much more efficient to let Google Analytics track this for you.
To set up a custom alert, go to Admin > Custom Alerts > + New Alert.
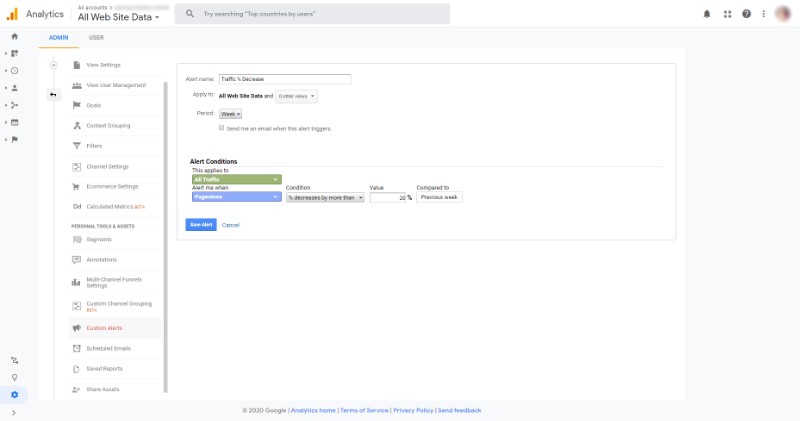
You’ll want to set up a custom alert for traffic decreases and traffic increases. To start, set your alerts to trigger on a 30% increase or 20% decrease week over week.
6. Track Content Updates Using Annotations
Google Analytics lets you add annotations to your reports that show up across the platform. These annotations are wildly useful for tracking changes.
For example, if you made a change to your site structure, figured out why a traffic drop happened, or are testing a new blog format, you can create an annotation to note it.
This helps you both track changes and monitor the effects of your changes over time.
7. Identify Slow-Loading Pages
Slow-loading pages can decimate your rankings. Not only do they impact user experience, but page speed is an important SEO ranking factor.
To find slow-loading pages, go to Behavior > Site Speed.
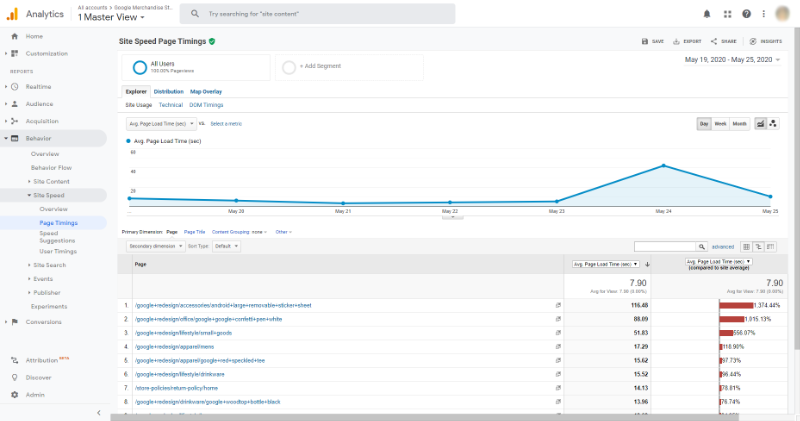
Once you know which pages are not loading as quickly as they should, you can take steps to improve their speed.
8. Create Custom Dashboards
With Google Analytic you can set up your own custom reports and dashboards so you can see the data you find more valuable, at a glance.
Google Analytics has pre-made templates that you can use to create custom dashboards and reports quickly.
Here are a few of the custom dashboards we like from the pre-made templates:
SEO Dashboard
This shows you various general information about your site’s SEO including things like organic visits, top keywords, top landing pages, and more.
Blog Dashboard
This dashboard shows how people find your blog, your most popular posts, and the search terms used to find you, among other things.
Site Performance Dashboard
The site performance dashboard shows you your average page load time, load times for your most popular pages, average server response time, and more.
9. Track the Right Metrics
One of the most important ways to boost your SEO with Google Analytics is by tracking the right metrics.
Our SEO experts recommend following these metrics closely:
Bounce Rate
You can learn a lot from your site’s bounce rate.
For starters, a low bounce rate could mean you have a technical issue on your site that is causing Google Analytics to track bounces incorrectly.
The most common cause of a low bounce rate is duplicate Google Analytics code on your site.
A high bounce rate can indicate any number of things. If you have a bounce rate higher than 70%, it could mean:
- You’re not attracting the right traffic to your site.
- Your visitors aren’t ready to commit.
- Your visitors aren’t getting the information they want.
- You’re not giving your visitors anything to do after they engage with the page they’re on.
- Your visitors are clicking links on your site that are taking them off-site.
Return on Investment
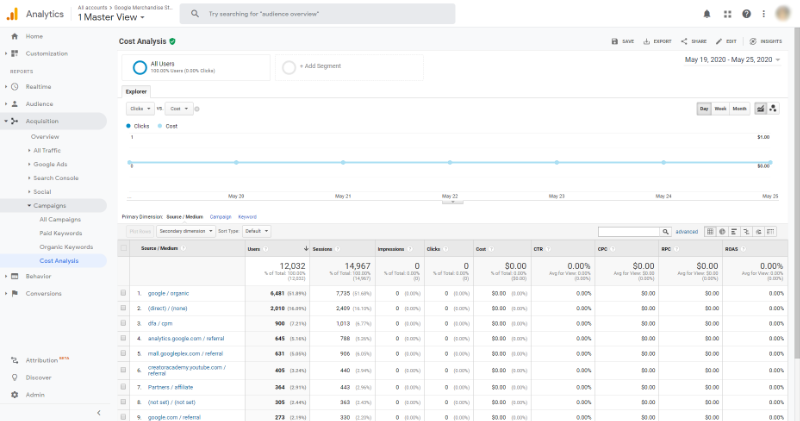
In Google Analytics, ROAS (Return on Ad Spend) is calculated as:
Conversion Value / Channel Spend
But, with the Cost Analysis report, you don’t have to worry about making those calculations. Just go to Acquisition > Campaigns > Cost Analysis:
Organic Conversion Rate
Traffic is nice, but converting traffic is better.
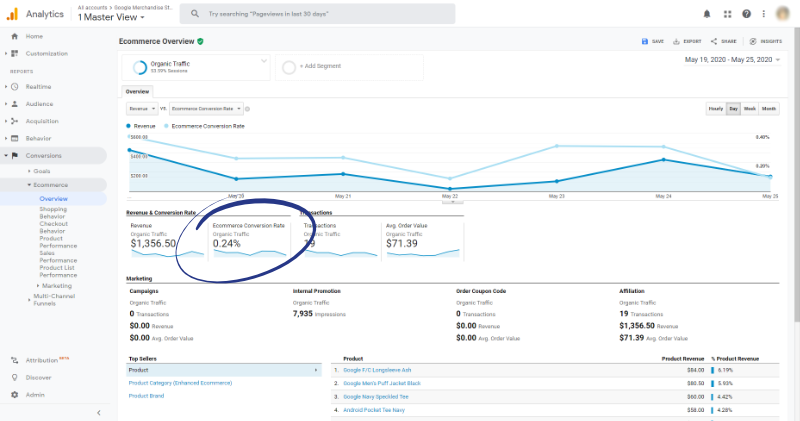
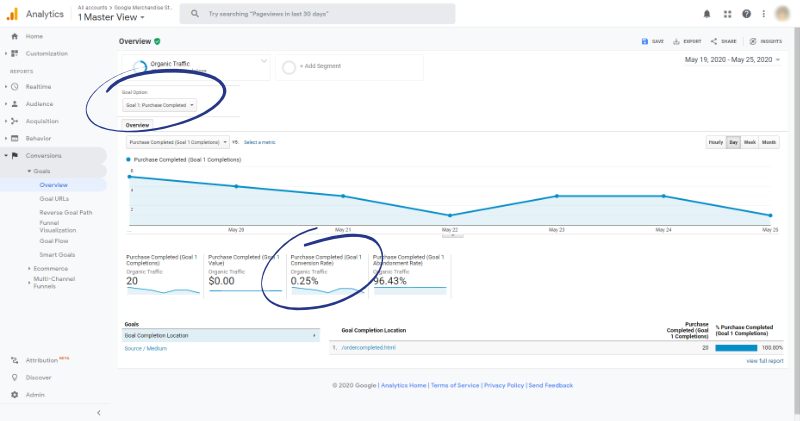
You can check your organic conversion rate two ways in Google Analytics.
If you have eCommerce tracking set up, go to Conversions > Ecommerce > Overview and set a segment of Organic Traffic:
If you have conversion goals set up, go to Conversions > Goals > Overview and set a segment of Organic Traffic:
Dwell Time
While Google Analytics doesn’t have a specific report for dwell time, it does track Avg. Session Duration. Go to Behavior > Site Content > Landing Pages and add an Organic Traffic segment.
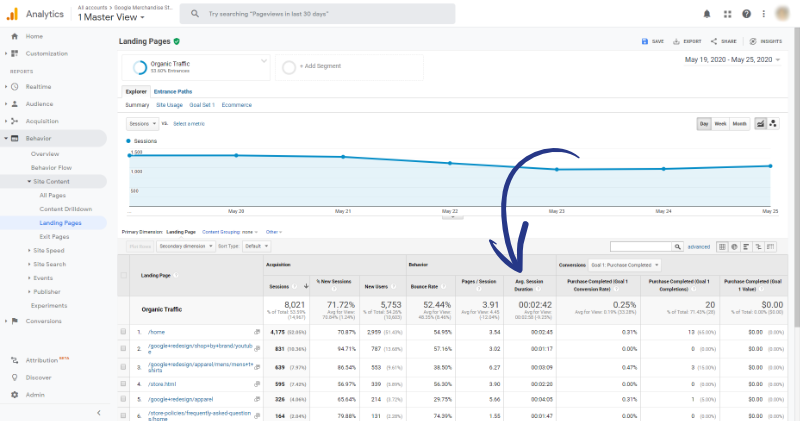
You’ll find what you need in the Avg. Session Duration column. It’s not exactly dwell time, but it still shows you how long Google searchers spend on your site.
A google average session duration is between 2–4 minutes.
Make Data-Driven SEO Decisions
With Google Analytics set up for your site, you’ll be able to see how your site, pages, and posts are performing. Google Analytics is the perfect tool to give you the information you need to make data-driven SEO decisions.
But Google Analytics is only as good as the time you have available to crunch the numbers and make adjustments. What if you just don’t have the time or skill to go it alone?
Hire an SEO agency to handle it for you!
Here’s a ranked list of the best SEO companies around. You’re sure to find the right one for you.


